Scientific Visualization
Our first work in computer graphics was a graphics library to visualize
scalar functions in one and two variable and algebraic curves for a
line printer. It was the 1979 and I were a young student interested
to the visualization of our numerical results of interpolation and approximation
problems.
Succesively my first work in 3D computer visualization
was on a Tektronix 4105 storage tube in 1981.
This page documents some of our research works about scientific visualization that
can be resumed in rendering scalar functions of two variables in Cartesian and spherical
coordinates by hidden-line algorithms.
The solution to many problem lies in scalar functions of two variables, the function being
deriving either by an explicit description or a grid values. In such cases may be
useful give a visual representation sufficiently realistic, but at the same time
speedly.
The analyzed algorithms and our proposals were specific for the class of functions
we dealt with. The research done was perfectly valid for its time. Moreover we well known
that as conditions change, so do the algorithms.
Today, hardware acceleration, changes the relative costs of algorithms and so
changes our ways of doing things. As example, we remember that some years ago,
an algorithm described as ridiculously expensive, now is called Z-buffer and
this hidden surface technique won out because it was easy to implement in hadware
and because memory densities went up and cost went down.
Cartesian Coordinate examples
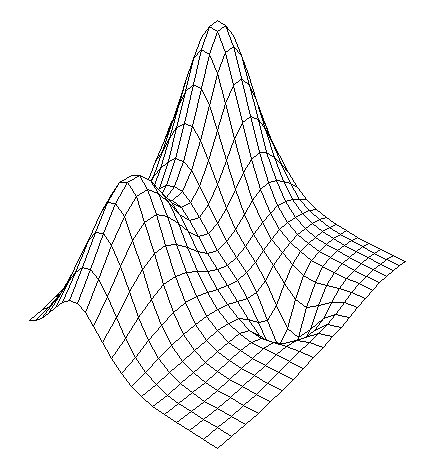 Analitic function (grid 20x20)
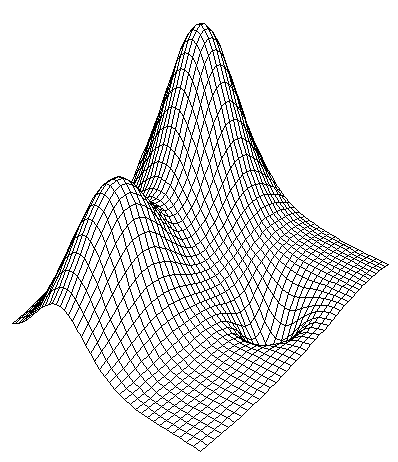 Analitic function (grid 40x40)
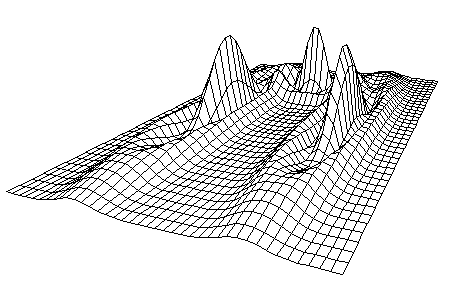 Kubert function (grid 40x40)
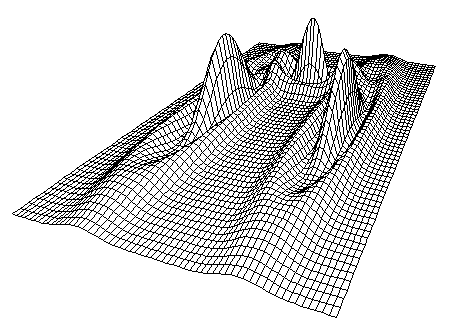 Kubert function (grid 60x60)
Spherical Coordinate examples
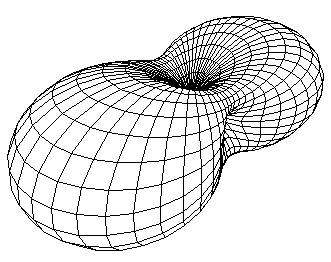 dipolo function
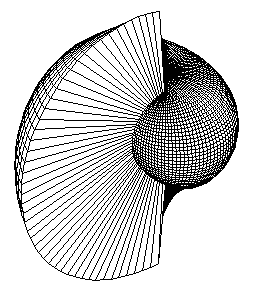 shell function
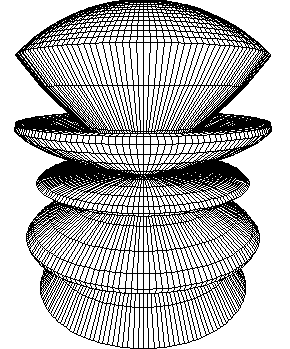 lobo function
 star function
Recently, our Cartesian Coordinate Hidden Line Algorithm, has been implemented in Java
Language and simply require the Java Virtual Machine.
References
-
G.Casciola, Basic concepts to accelerate line algorithms,
Computers & Graphics, vol.12 n.3/4 (1988).
-
L.Alvisi, G.Casciola, Two and Four Array Mask Algorithms in
practice, Department of Mathematics, University of Bologna, (1988).
-
L.Alvisi, G.Casciola, On the Two Array Mask hidden-line algorithm,
Computers & Graphics, vol.13 n.2 (1989).
-
L.Alvisi, G.Casciola, TAM rivisitato: un metodo rapido ed esatto per
la rappresentazione prospettica di superfici, PIXEL, n.10 (1988).
-
A. Amoroso, G.Casciola, L'algoritmo PAM nella modellazione con superfici
spline in coordinate sferiche, Atti dell'Accademia delle Scienze
dell'Istituto di Bologna, Serie V, n.6 (1995).
-
A.Amoroso, G.Casciola, A new approach to perspective
views of spherical coordinate functions, Department of Mathematics,
University of Bologna, (1998).
 Analitic function (grid 20x20)
 Analitic function (grid 40x40)
 Kubert function (grid 40x40)
 Kubert function (grid 60x60)
 dipolo function
 shell function
 lobo function
 star function